Summary of Strands report
Use this report to display maximum points possible, mean percentage, and number of correct items in a new chart format.
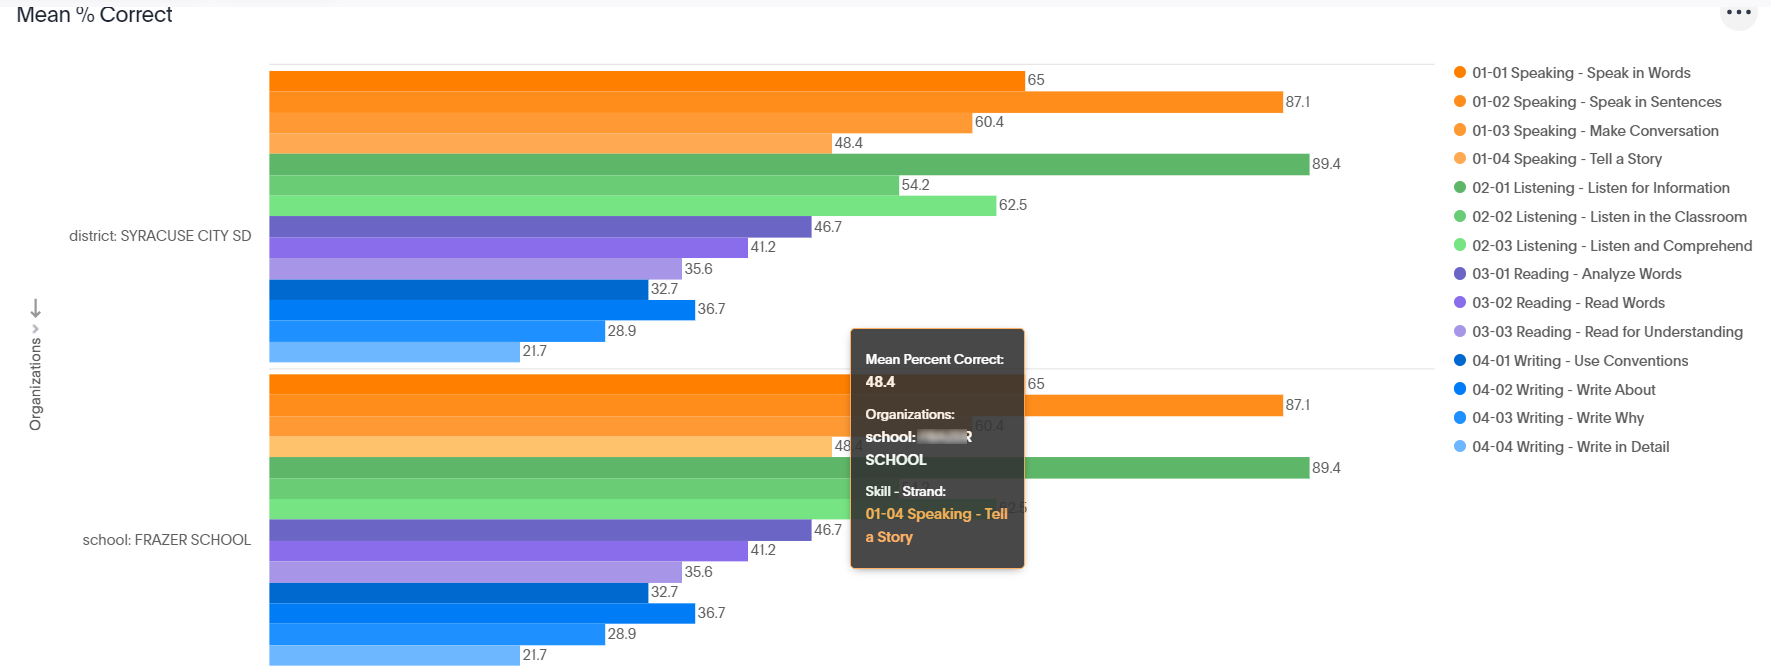
The top of the report is the Mean % Correct chart, shown below. Hover the cursor over a section of the graph to display details.
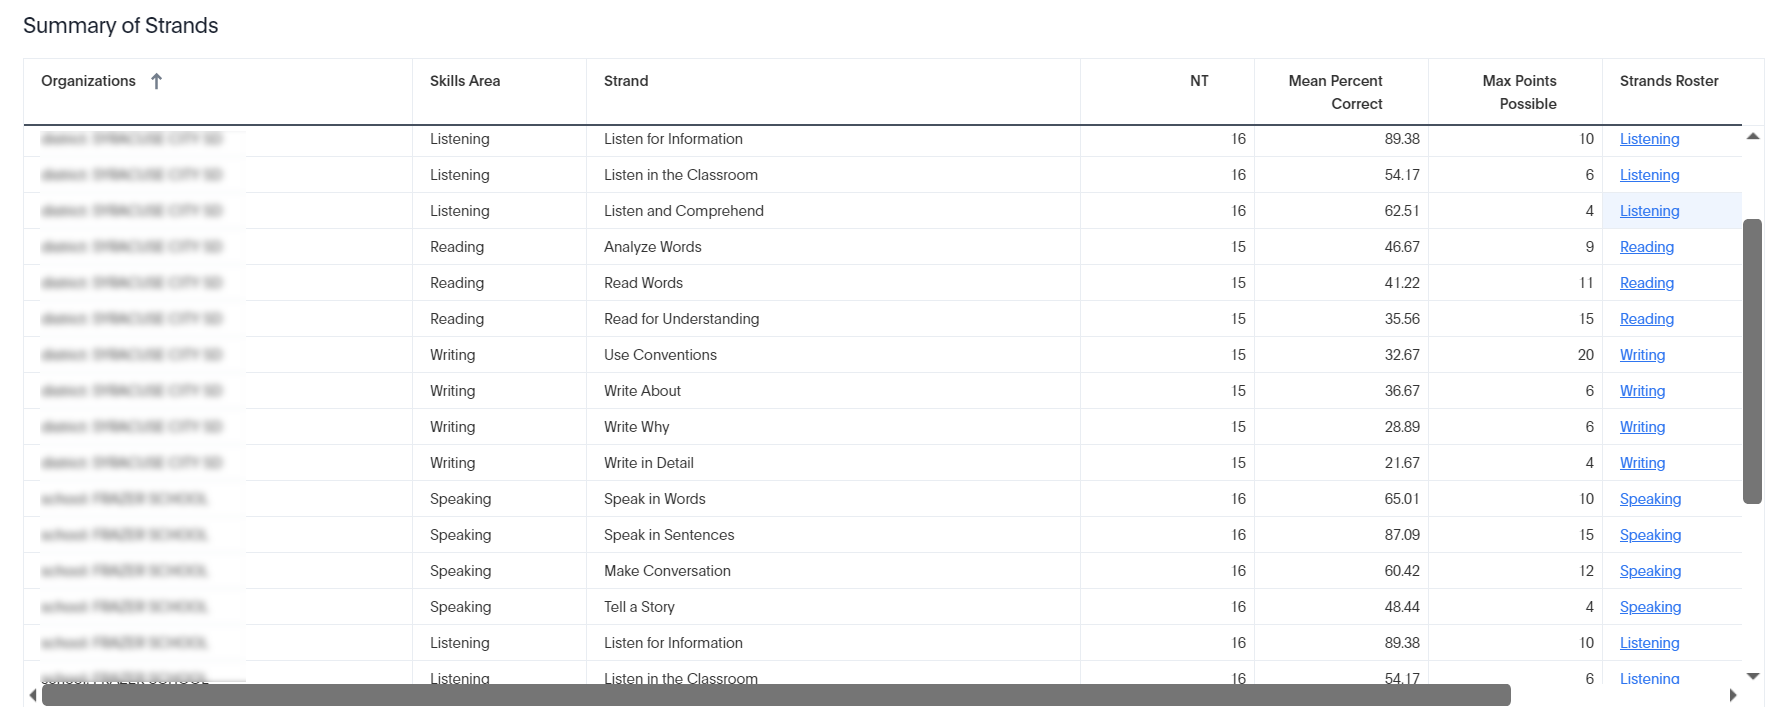
The Summary of Strands data table displays at the bottom of the report. Click a link in the Stands Roster column to display the testing roster for a section of the test at the district or school level.