Factor Detail Page
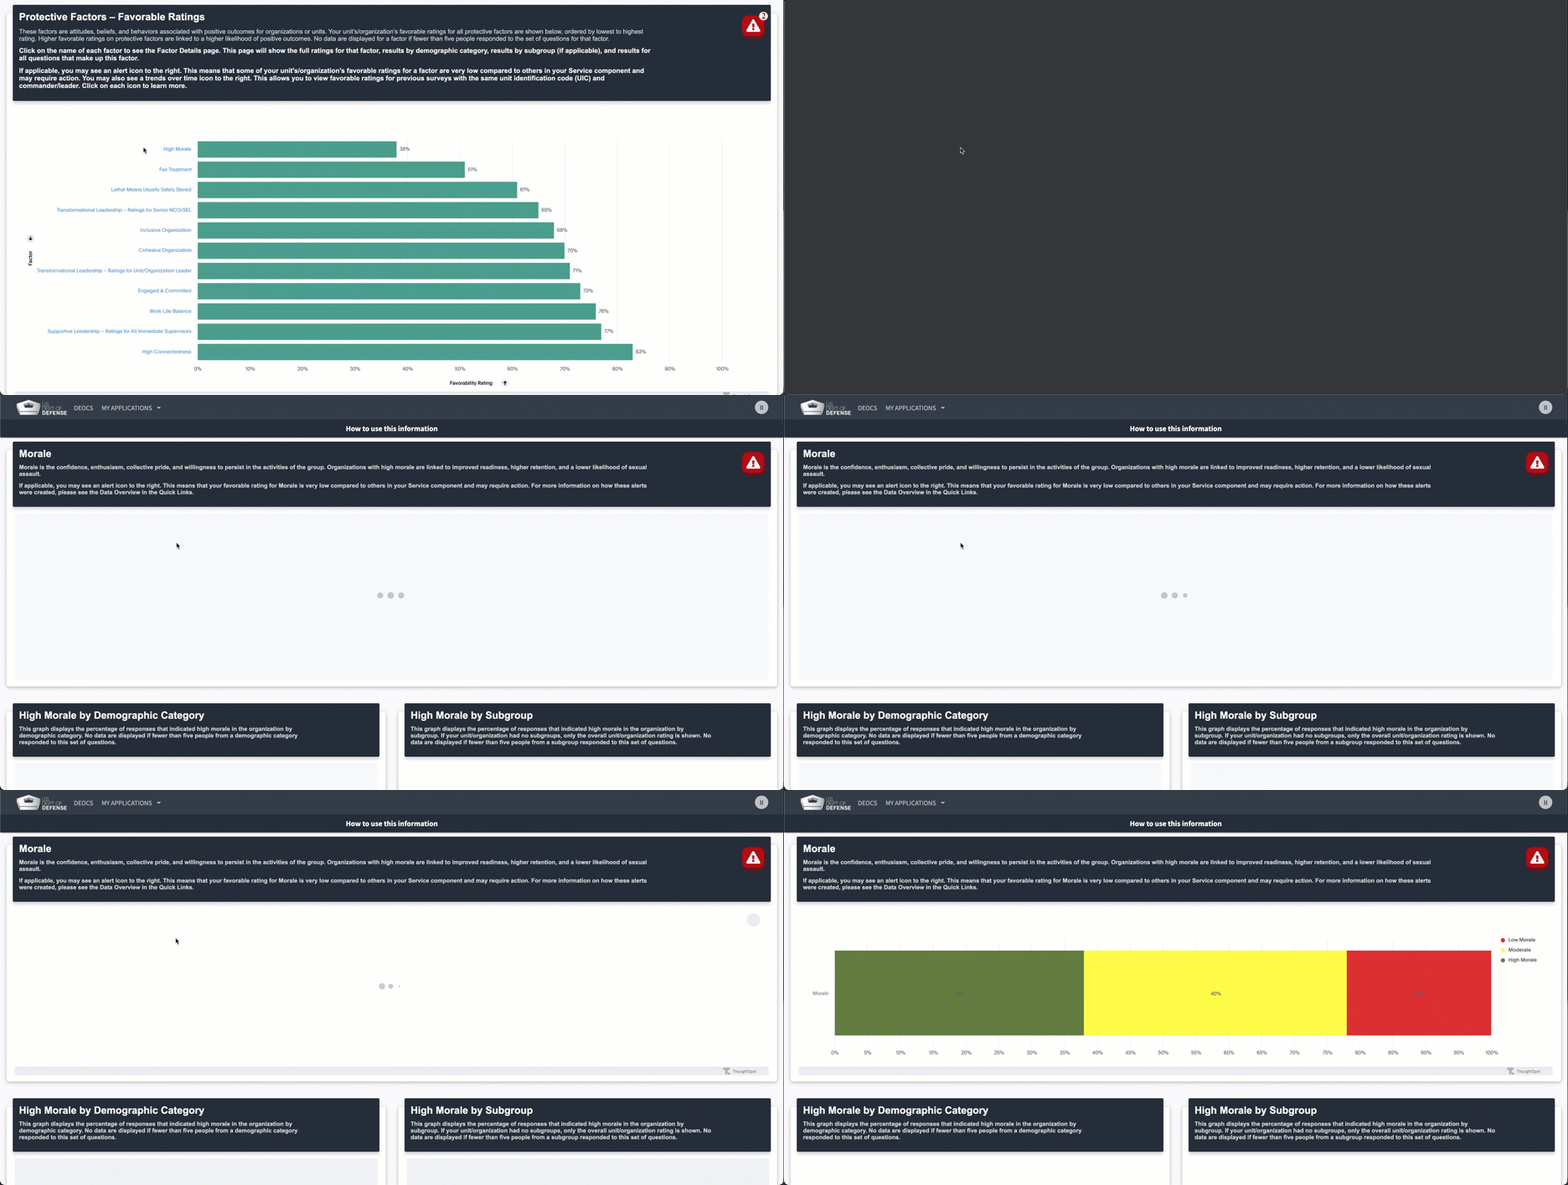
To view more results for a particular factor, click on the factor names that appear in the bar graphs on the Factor Ratings tab.
Icons
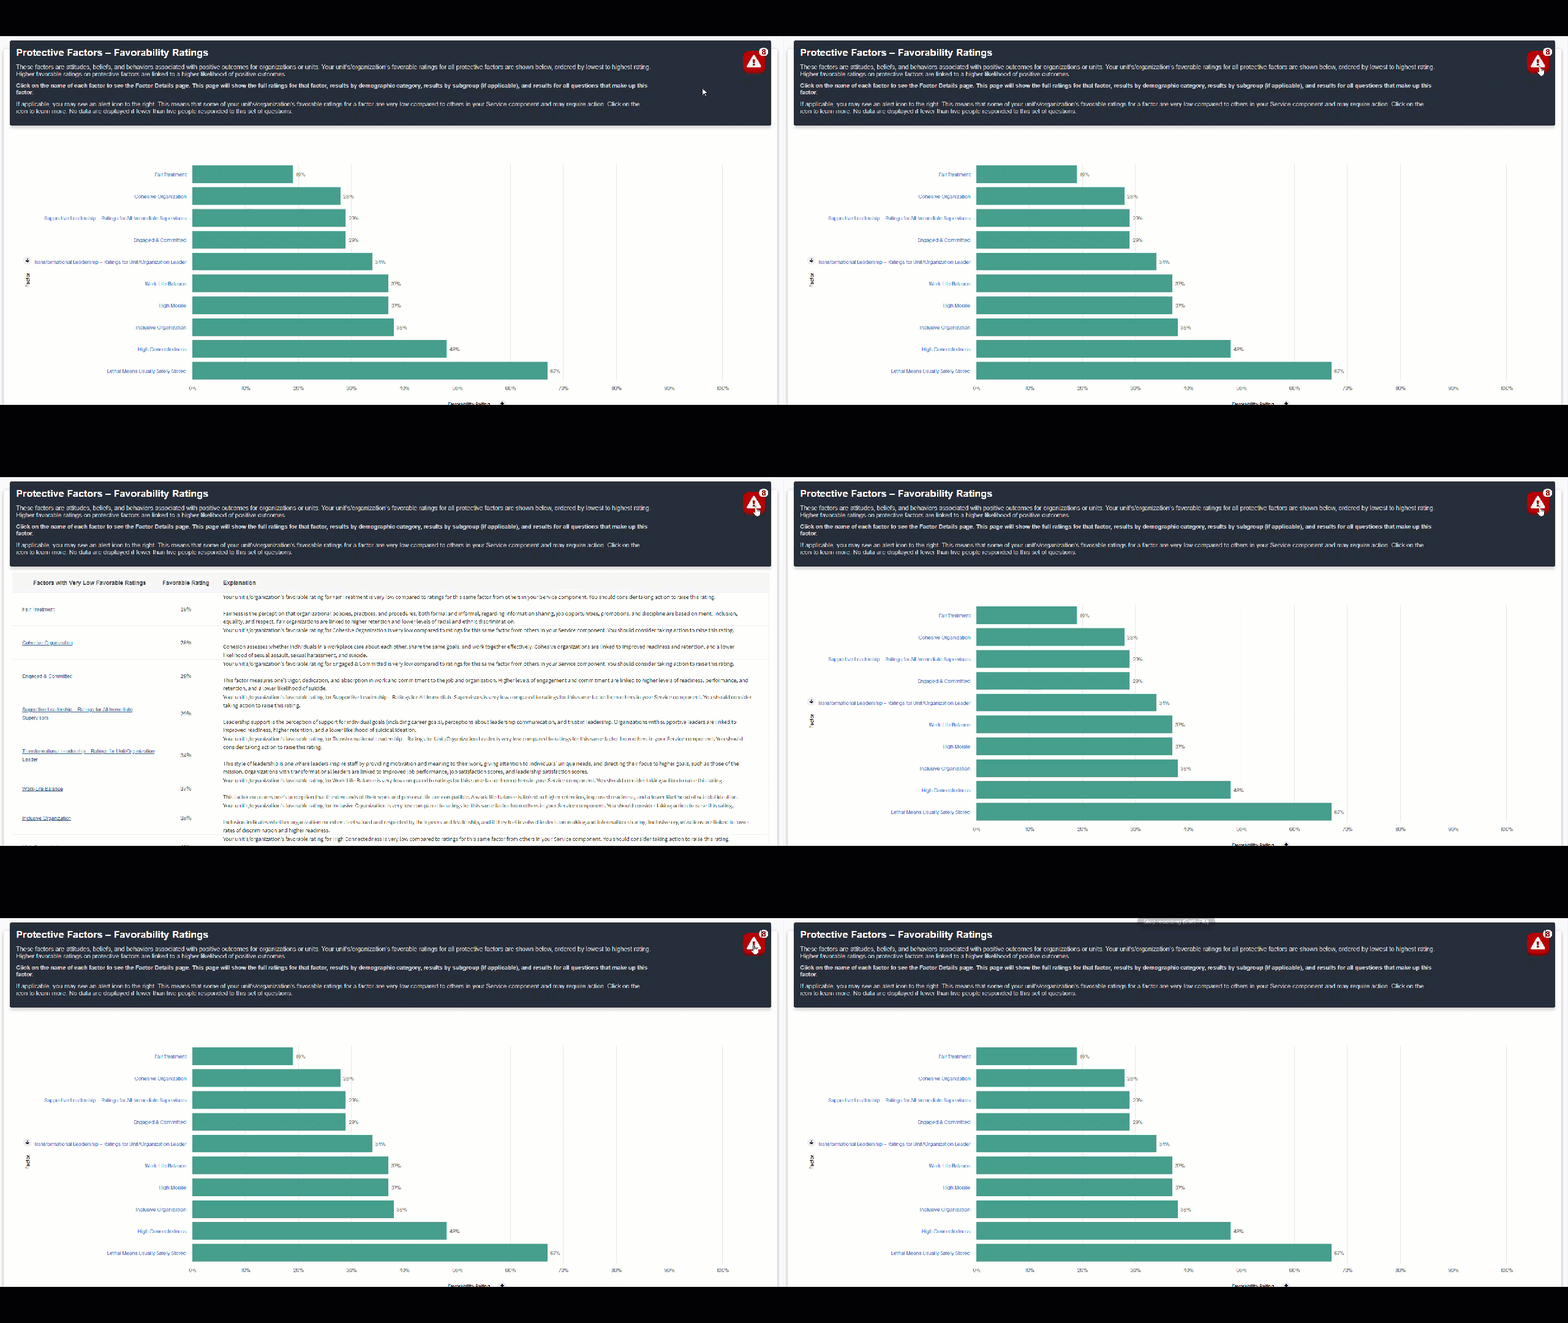
Click on the icons that appear on the Factor Ratings tab to view more information. For example, the alert icon shows more information about the factors that may require action.
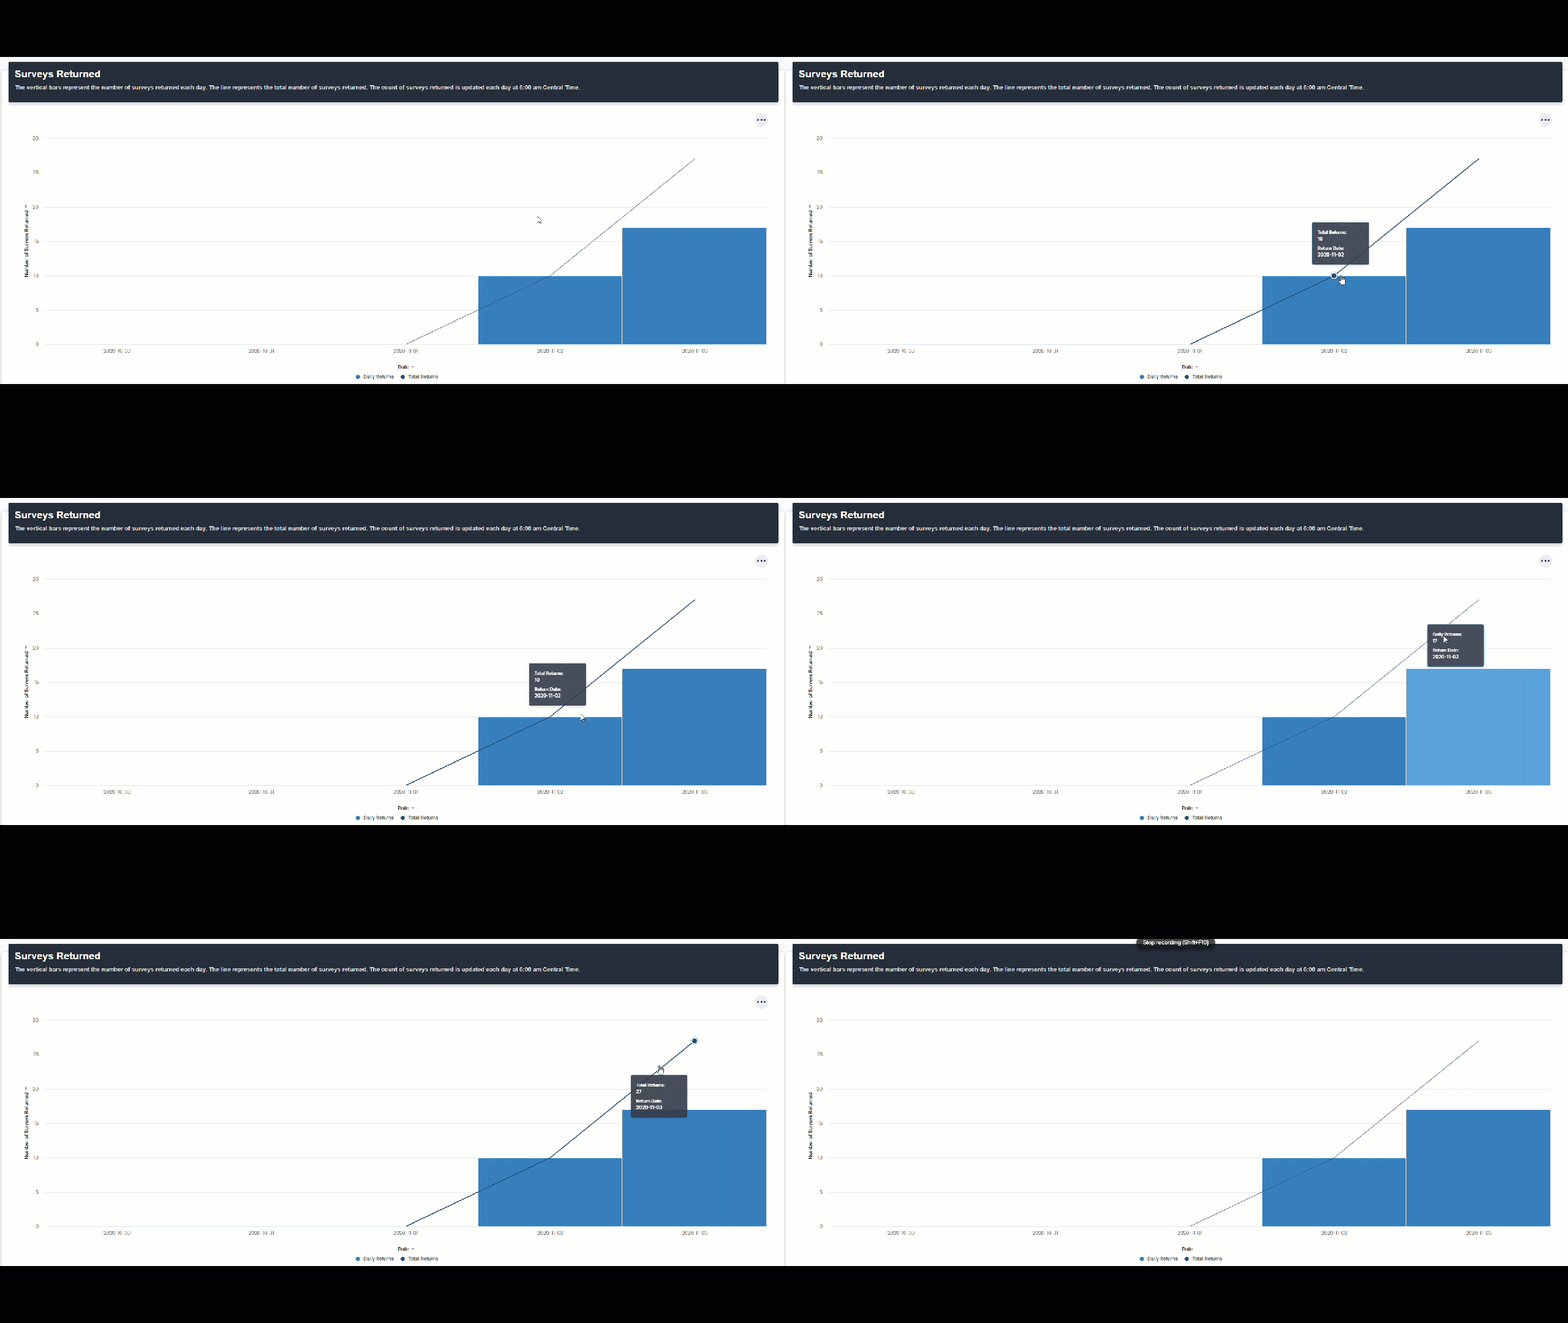
Tool tip
Hover over data in a graph to view more detailed information.
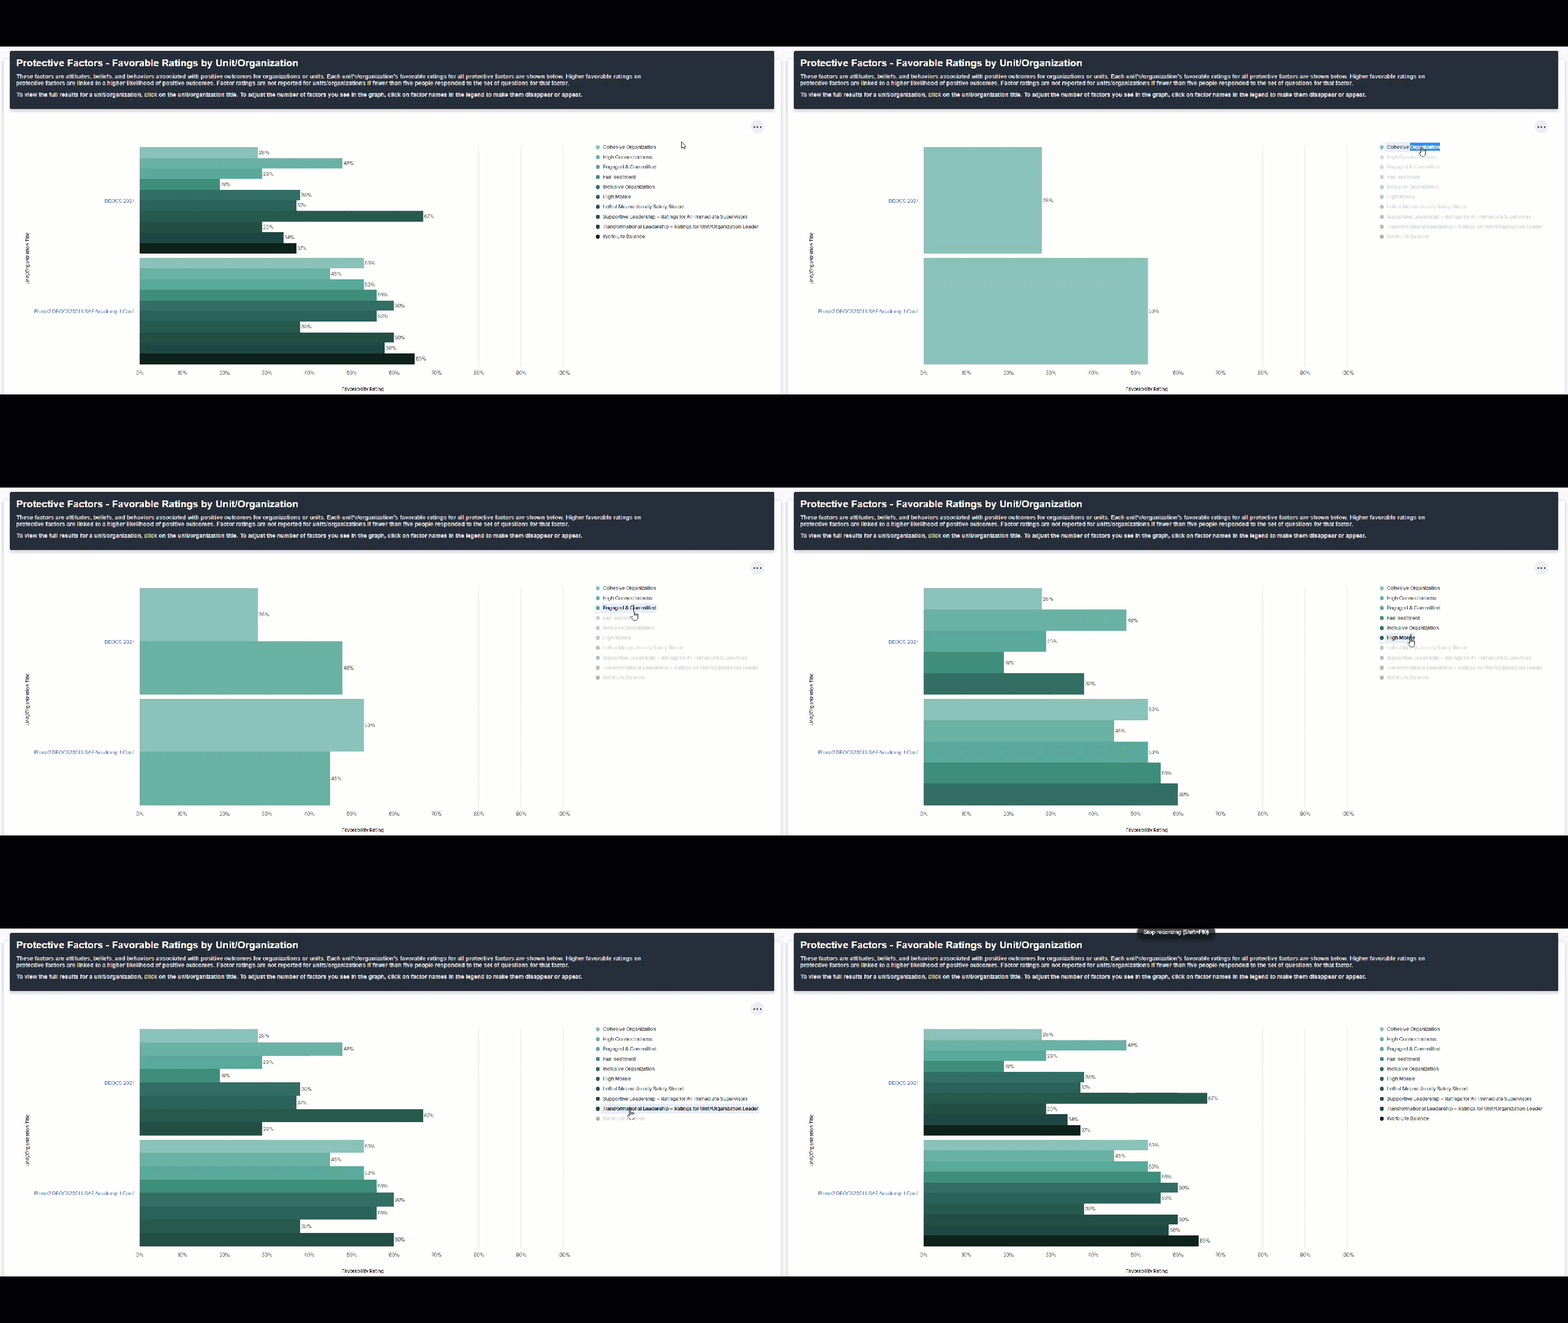
Legend
Click on response options in a legend to make them disappear or appear in the graph.
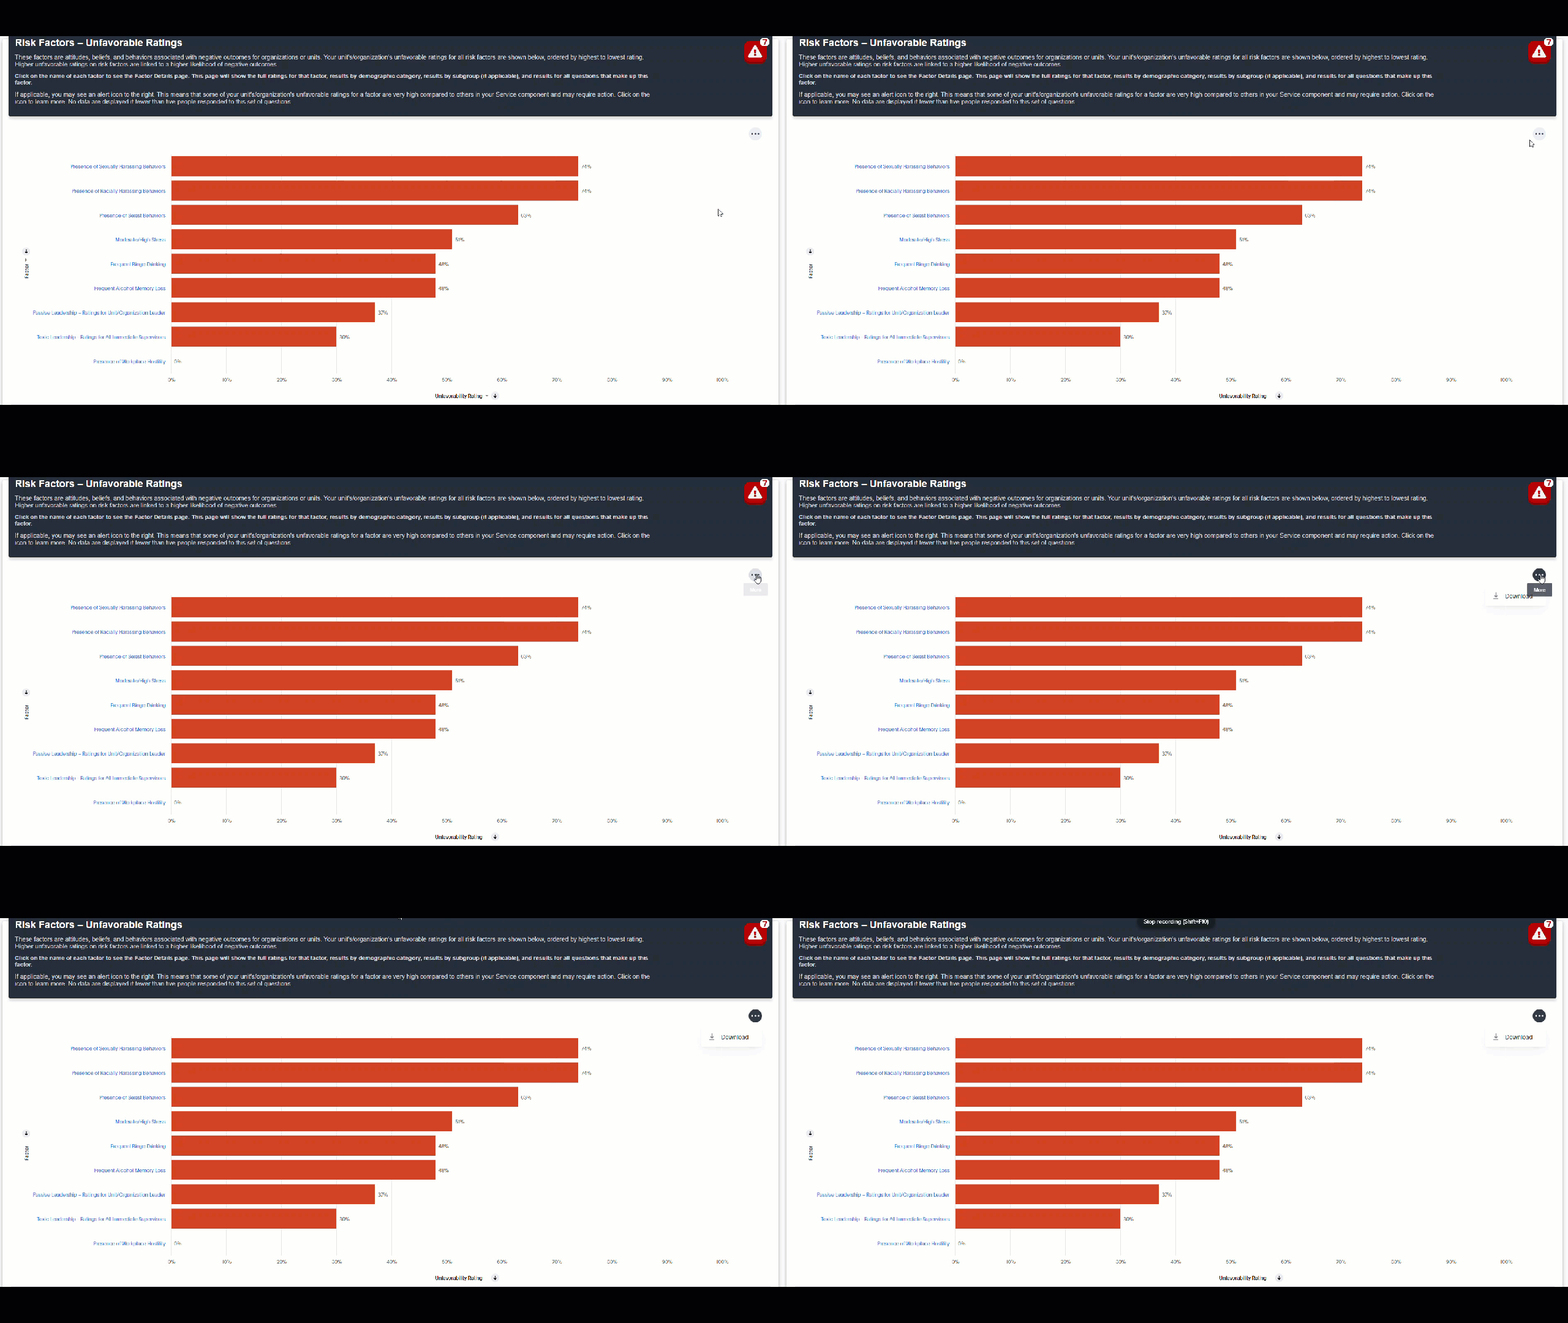
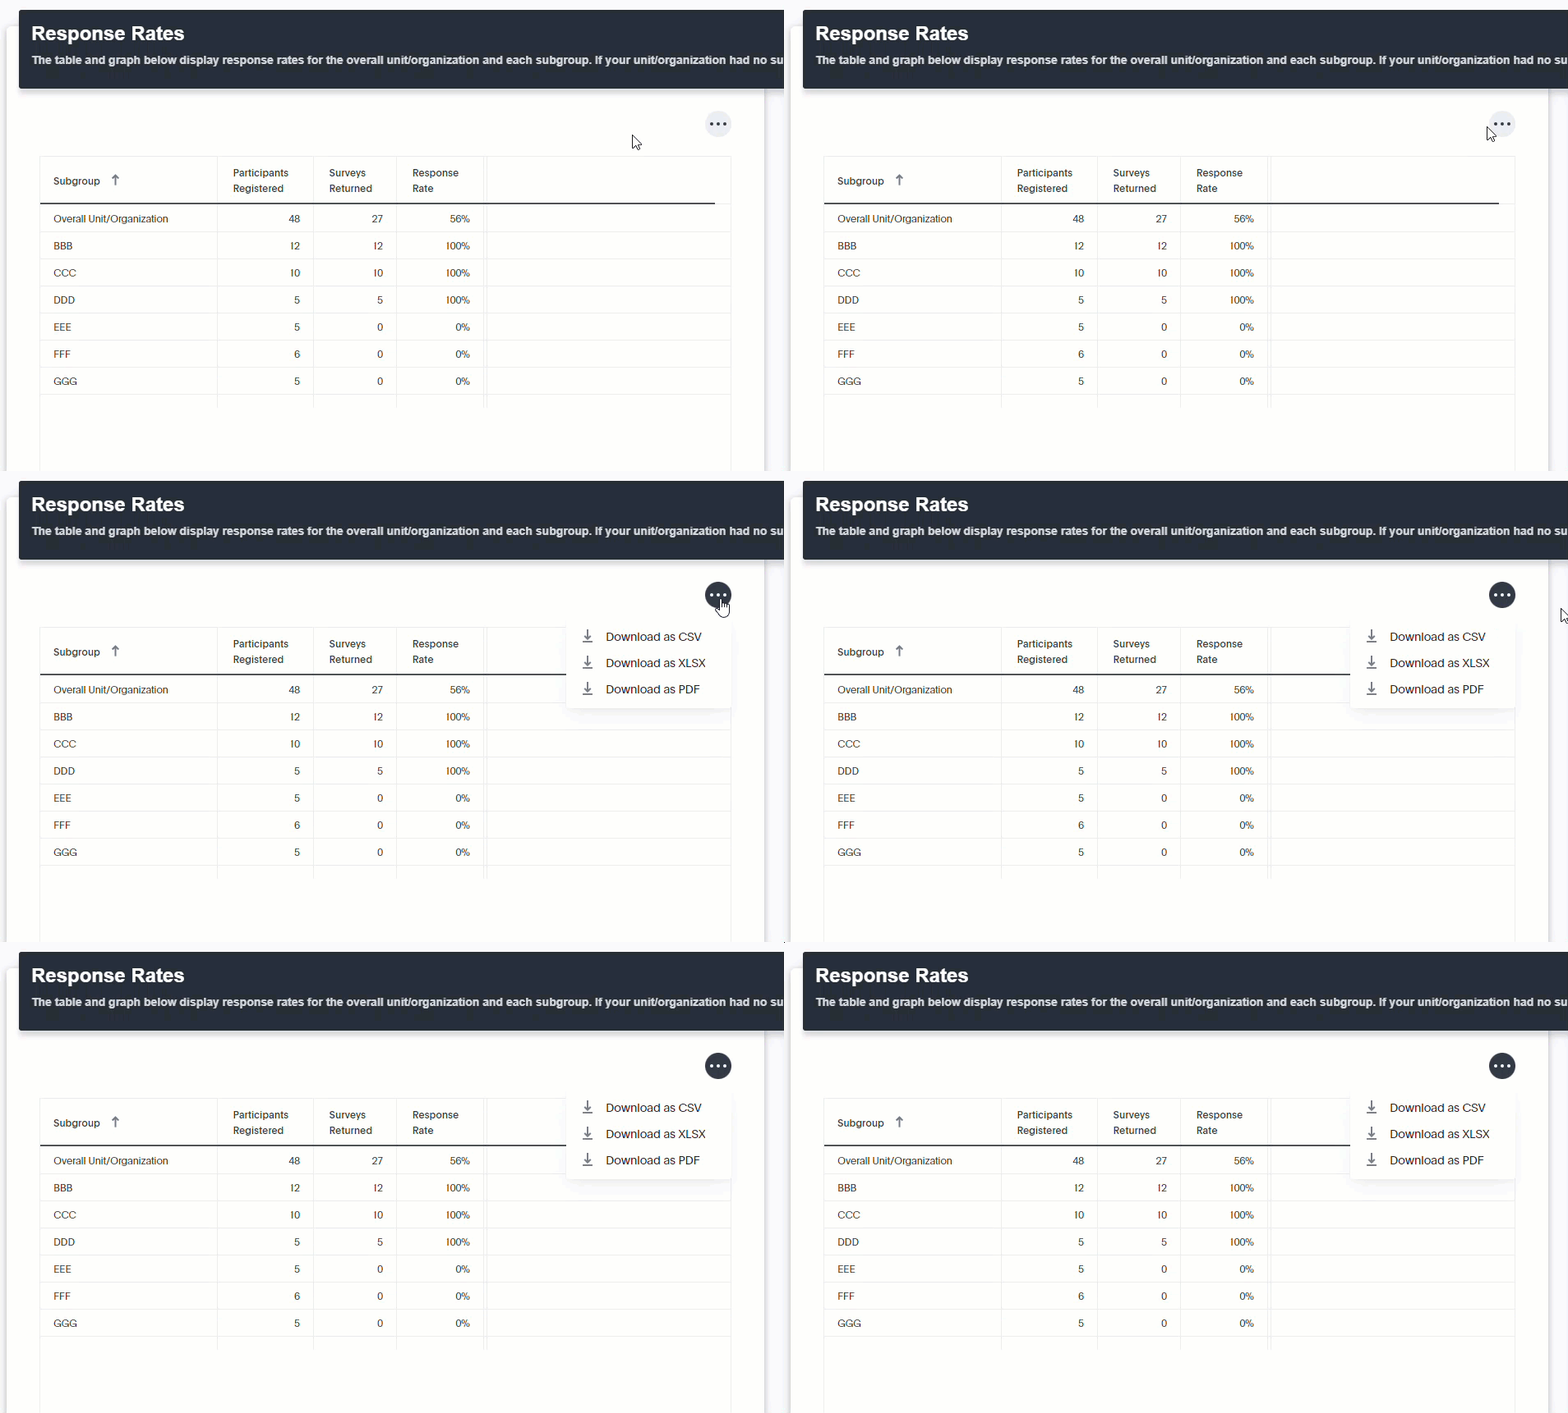
Download Graphs and Tables from the Chart Menu
Most graphs and tables have a menu associated with it which allows users to download them. Graphs can be downloaded as an image file (.png) and tables can be downloaded as comma-separated values file (.csv), excel file (.xlsx), or a PDF (.pdf). Click on each chart’s menu to see available options.
Sort and Filter Tables
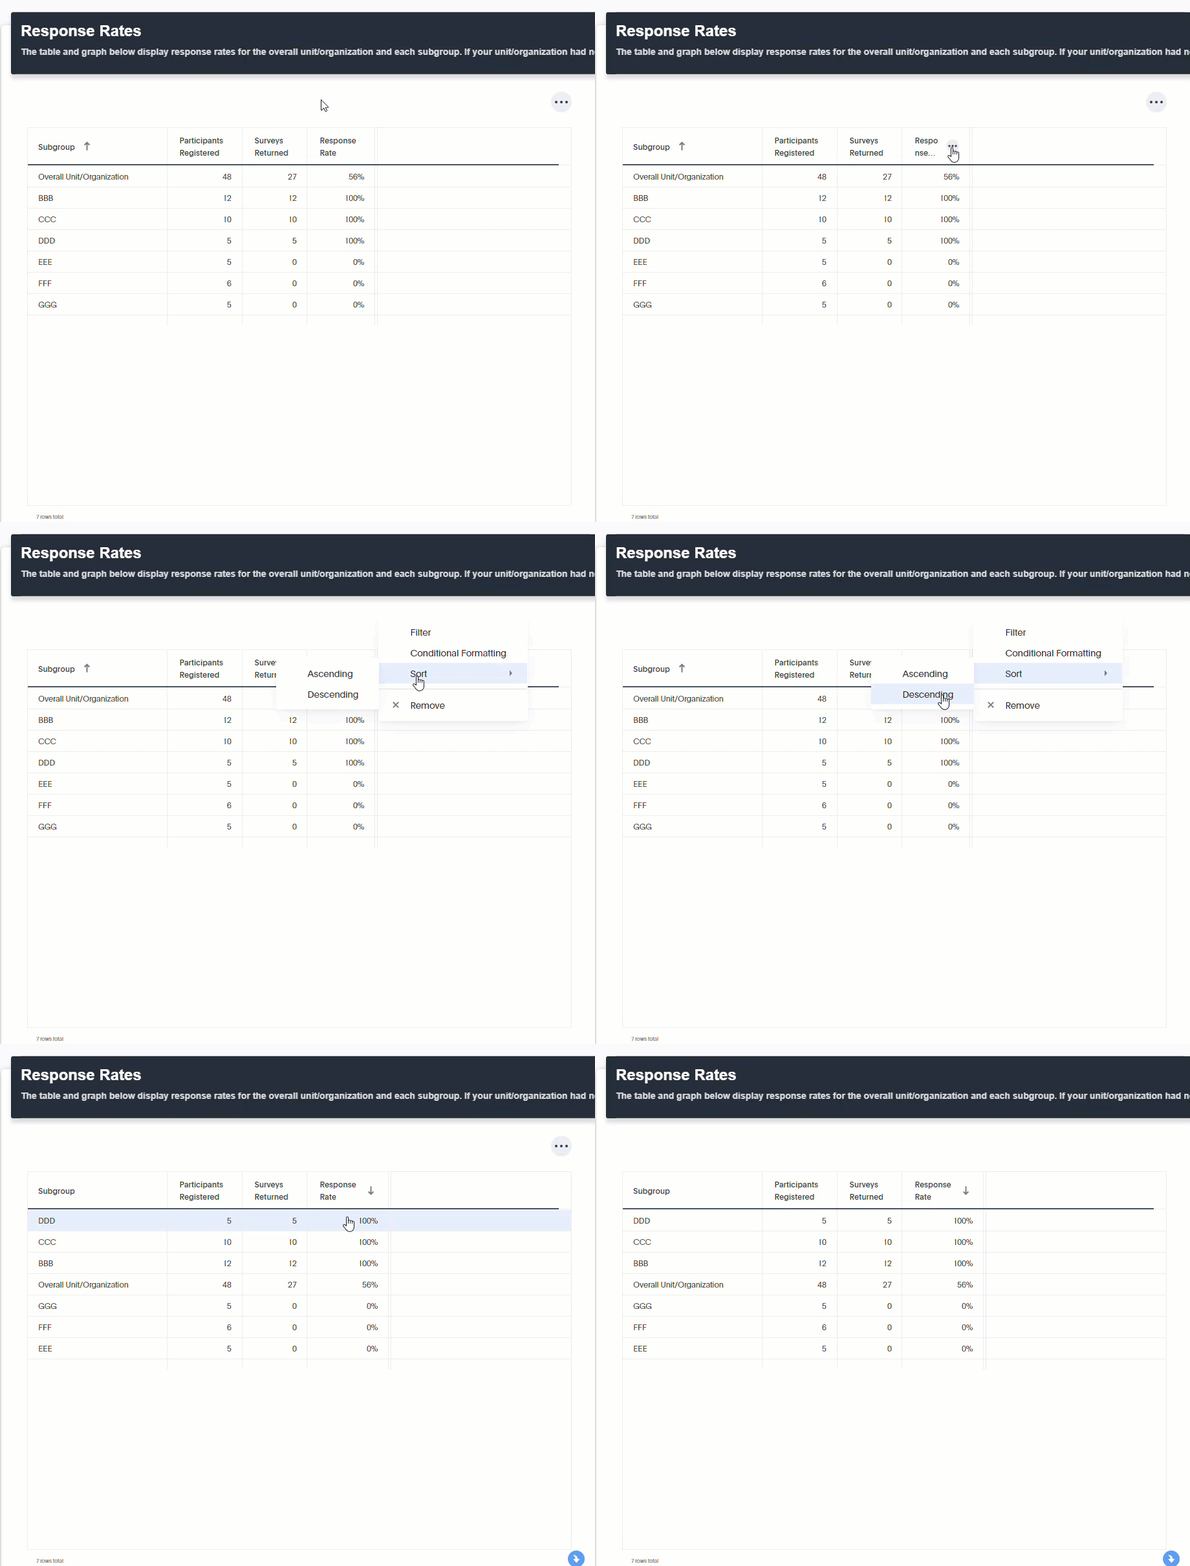
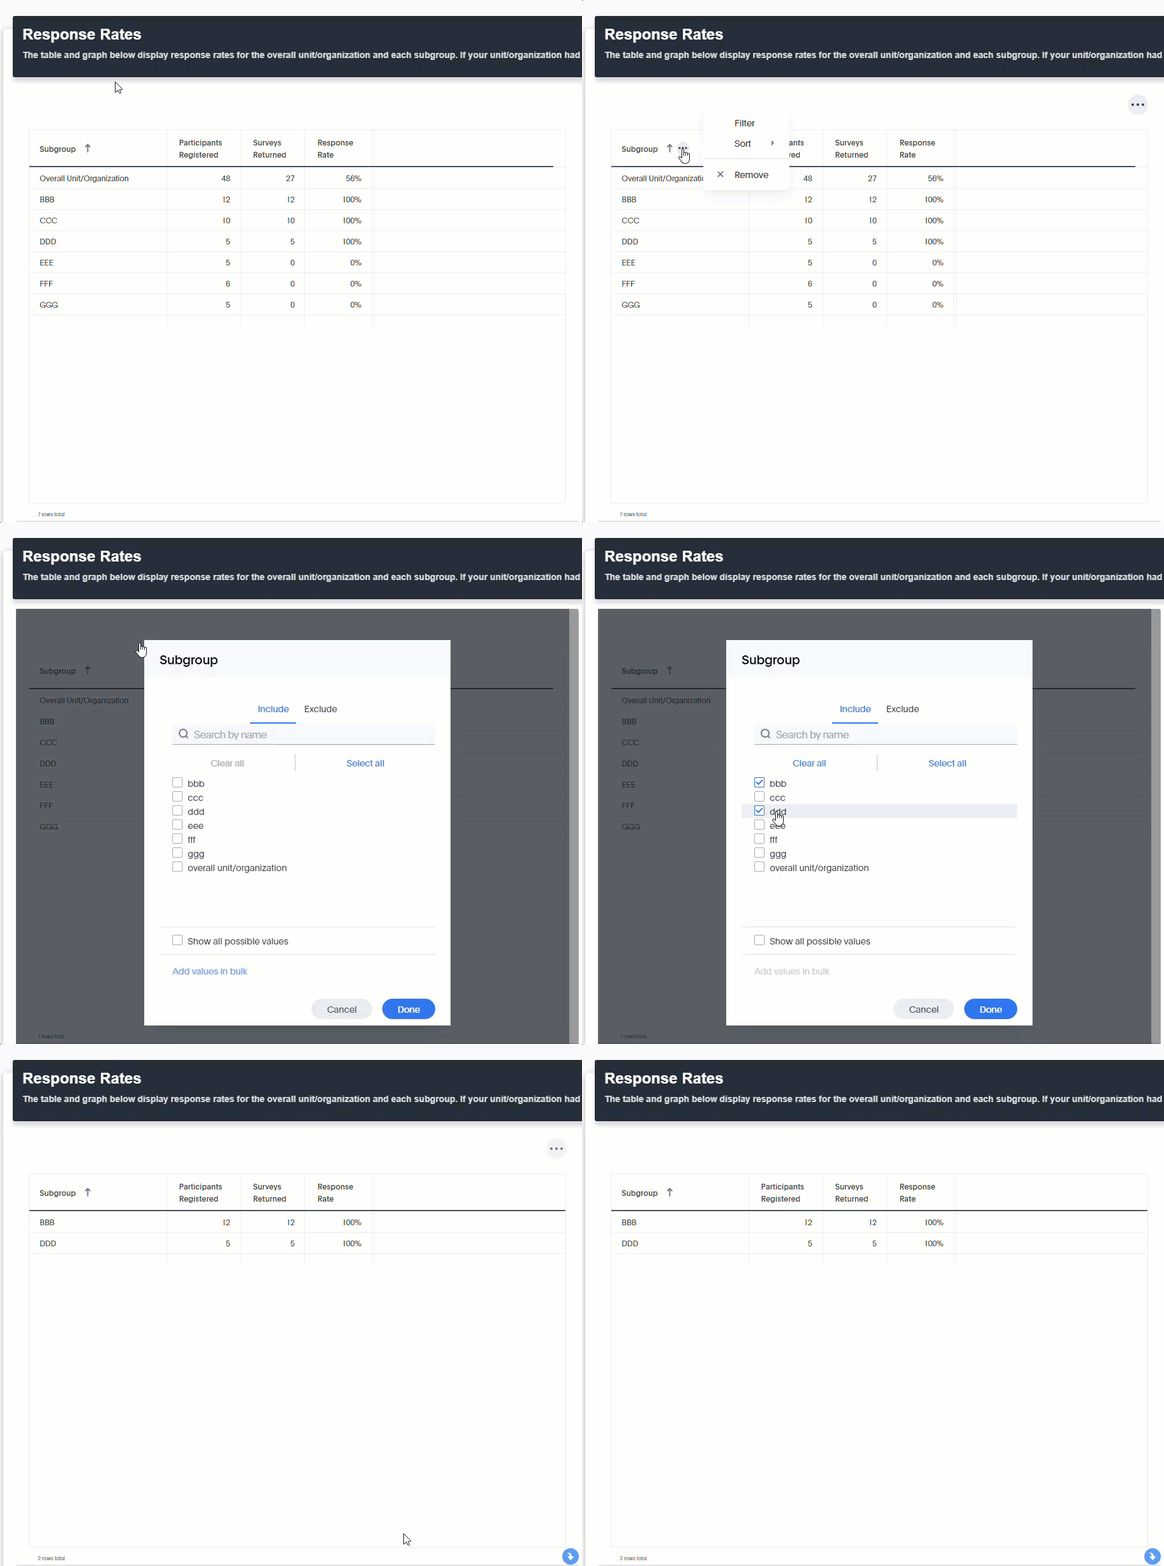
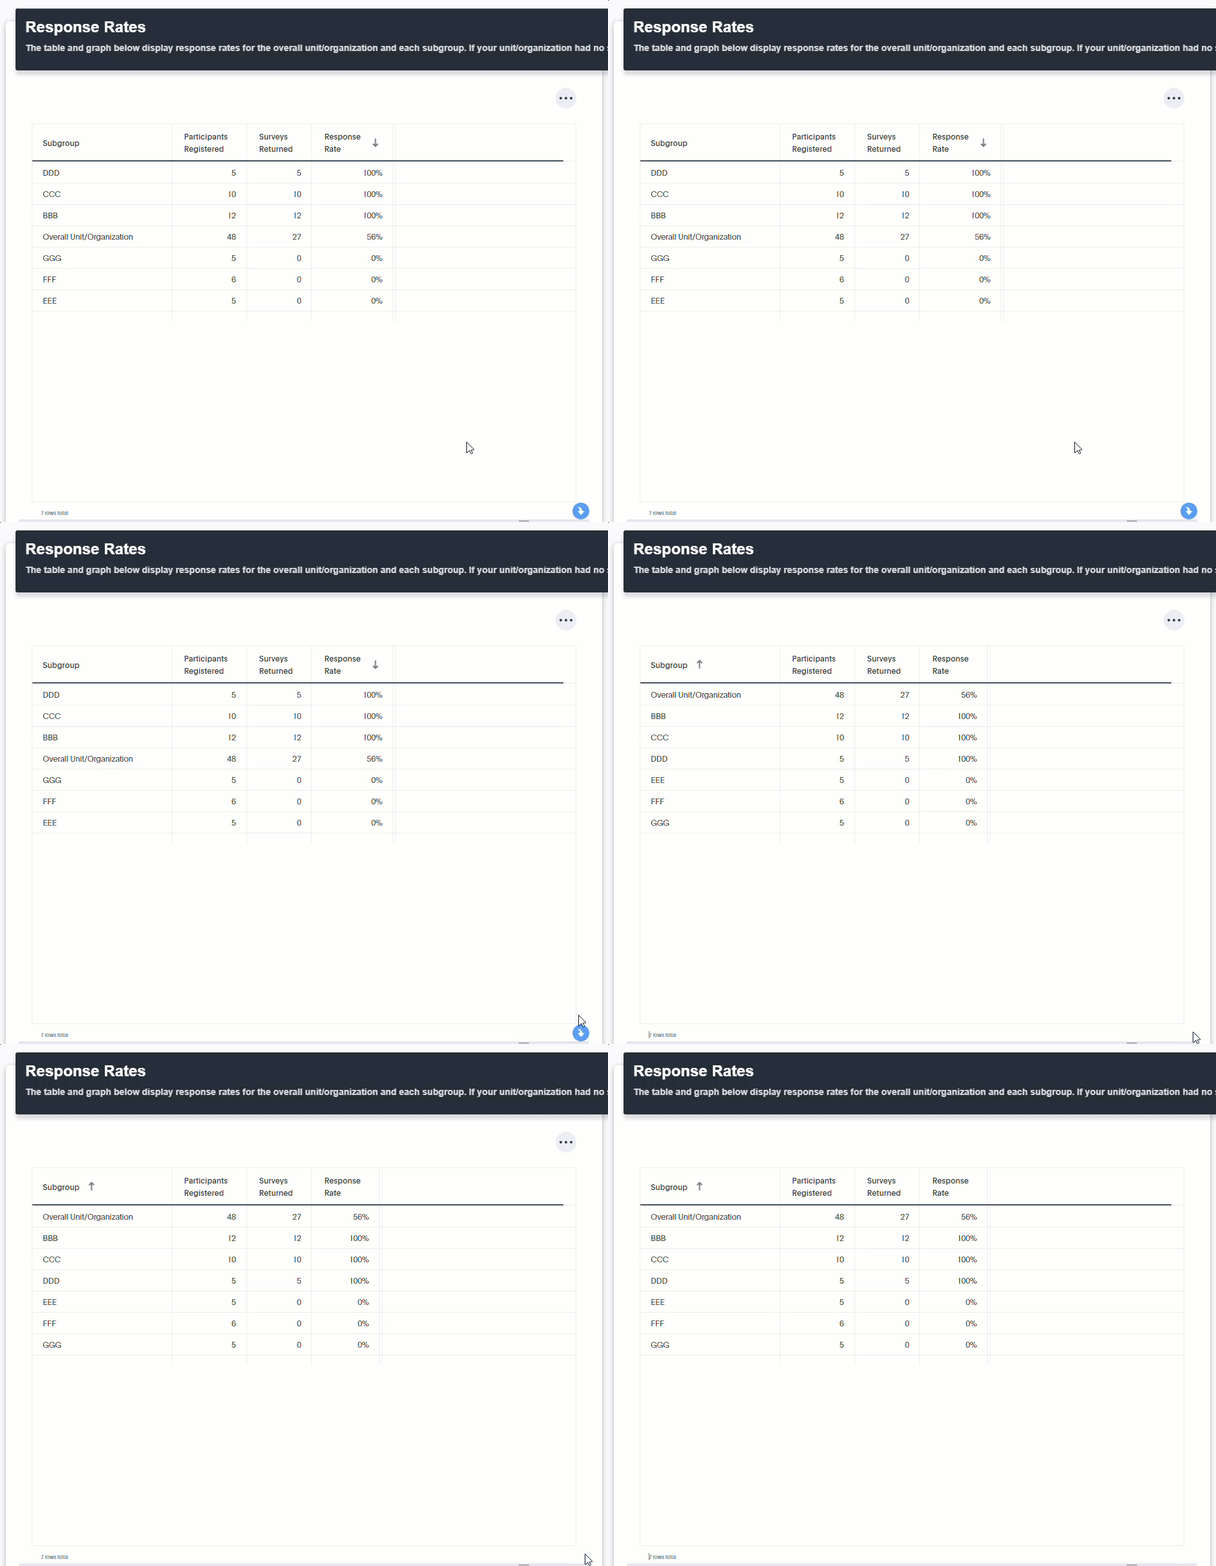
Tables can be sorted and filtered by clicking on the three dots next to any heading and selecting the appropriate options. After a sort or filter, clicking the blue arrow in the lower right corner returns the table to the prior order.
Sort
 |
Filter
 |
Return to Prior Order
 |
Tips
Most of the graphs and tables in the dashboard have a text description. In some cases, the description is too long to fit on the screen and you will see it trail off with “…” Hover over the text and a new box with the full text will pop up.
Every graph in the dashboard has labels that tell you to which factor or data point the results correspond. If you notice that any graphs or tables are missing labels, you may need to adjust the zoom on your browser from 100% to 90% or lower.
To see the label, adjust your browser’s zoom using the steps below:
- Click your browser's menu
- Adjust zoom of browser
- After logging in to your DEOCS Portal account, click “My Application” in the menu along the top banner. Select “Interactive Dashboard.”
- The Dashboard is organized by a set of menu tabs along the top. More details about the information on each tab are below.
Response Rate: Displays up-to-date information about how many people in an organization have completed the DEOCS since the start date. This is an important tab for survey administrators to monitor once the survey starts. If the response rate is very low, survey administrators may want to move the end date to allow more people to complete it. This tab will also display response rates for subgroups, the number of completed surveys by day, and, if applicable, response rate trends for previous surveys with the same Service component, unit identification code (UIC), and the same commander/leader. For more information on this tab, see DEOCS Fielding.
Factor Ratings: Contains a summary view of the results for the unit/organization or units/organizations selected including the favorable ratings for each protective factor and the unfavorable rating for each risk factor. Use the filters to select one or more units/organizations for which you’d like to see results and then click the “Go” button.
When selecting a single unit/organization, the favorable ratings are displayed for each protective factor ordered from lowest favorable rating to highest favorable rating
and the unfavorable ratings are displayed for each risk factor ordered from highest unfavorable rating to lowest unfavorable rating. To see more detailed information about a factor, including ratings by demographic group, ratings by subgroup (if
applicable), and detailed results for each question, click the factor name on the y-axis of the bar graph.
When selecting more than one unit/organization, the favorable ratings for each unit/organization are displayed for each protective factor ordered alphabetically and the
unfavorable ratings for each unit/organization are displayed for each risk factor ordered alphabetically. To see the results for a single unit/organization from this view, click the unit/organization name on the y-axis of the bar graph.
Depending on the results of your survey, the Factor Ratings tab may also display:
-
An alert if any of your protective factor favorable ratings are very low compared to others.
-
An alert if any of your risk factor unfavorable ratings are very high compared to others.
-
Trends over time if there are previous surveys with the same Service Component, the same unit identification code (UIC) and the same commander/leader.
From the Factor Ratings tab, users may also access Factor Detail pages, which display detailed results for each factor measured on the DEOCS. Factor Detail pages are accessed by clicking on the factor name in the bar graphs displayed in the Factor Ratings tab. Factor Detail pages display the full factor ratings for each factor, results by demographic category, and results by subgroup, if designated on the roster. Additionally, Factor Detail pages display the results for all questions on the DEOCS that make up a factor. This view can be used to provide more context into overall factor ratings.
Custom Items: Contains the results for optional questions that may be on your unit’s/organization’s DEOCS. Use the Section filter to select the results you’d like to view.
-
Select Custom Close-Ended to view results for any custom close-ended questions that you added to your DEOCS.
-
Select Service-Specific Items to view results for any questions your Service component may have added to your DEOCS on your behalf.
-
Select Academy-Specific Items to view results for questions only asked of Military Service Academy cadets and midshipmen and Military Service Academy Preparatory School cadet candidates and midshipmen candidates.
Item Summary: Detailed results for all questions related to protective factors, risk factors, custom multiple close-ended items, Service-specific items, and Academy-specific items on your DEOCS.
Download: The Download tab contains several options that allow you to download a report for a single survey, single subgroup, or combined subgroups. DEOCS 5.0 and 5.1 reports are available to download for five years after the close date of the survey. The report options are:
-
Survey Results: This report contains all survey results, including overall factor ratings, factor ratings by demographic groups, and detailed tables with response frequencies for each survey question.
-
Executive Report: This report includes overall survey results and subgroup survey results in one report. It does not contain detailed tables with response frequencies for each survey question.
-
Comments: This report includes comments from the open-ended survey questions, as well as any custom short answer open-ended questions or SAQs that were included on the survey. The comments report is only available for organizations or units with at least 16 participants; subgroups must also have at least 16 participants in order to receive a comments report.
The Combined Reports tab allows you to select DEOCS registrations to aggregate together to create a combined report. There are more details and instructions on this tab to help you create combined reports.
Interpretation Guide: The Interpretation Guide tab provides information about each factor including its definition, a summary of research on how it relates to key outcomes, how to read your factor ratings, how factor ratings are created,
how to put your ratings into more context, and a list of scientific references for each factor. You can also download a PDF copy of the full document or individual factor sections.
Quick Links: Contains PDFs users can download to learn more about DEOCS results in the dashboard. There are three main documents in this tab, though new documents highlighting important information may also be added here. The three main documents are:
-
Data Overview: The Data Overview provides information on alert icons and why they appear, information on trends over time, how demographic categories are created, and why some data are not reportable.
-
Strategic Target Outcome Guide: The Strategic Target Outcome Guide focuses on strategic target outcomes (STO) and how they align with the 19 DEOCS factors measured on the DEOCS 5.0. It is intended to assist unit commanders, DoD leaders, and IPPW staff as they review and analyze their DEOCS results and develop their unit/organization specific action plan to improve their organizational climate. Specifically, the STO Guide will help you assess areas of concern related to sexual assault within your unit based on responses to the risk and protective factors associated with sexual assault.
A minimum number of 16 responses is required to receive a DEOCS report. If your DEOCS has ended and it does not have at least 16 total responses, a report will not be generated.
In addition, a minimum number of 5 responses is required to receive a DEOCS survey results report for subgroups. If subgroups have fewer than 5 responses, a report will not be generated for that subgroup.
You will see this message when trying to access results in the interactive dashboard when there are not enough survey respondents: "Reports not available. Please see Response Rate tab for additional detail on Survey status."
A minimum number of 16 responses for a subgroup is required to receive a comments report for a subgroup. If there are enough respondents to see a comments report, you will see this option in the “Report” filter dropdown; if there are not enough respondents, you will not see this option in the filter dropdown.
For more information on not reportable data, download the Data Overview PDF from the Quick Links tab.


